For setup and source errors, see Data sources or Troubleshooting.
This page describes 1.7. See what changed from 1.6.
Platform and requirements
Does it work on macOS or Linux?
No. The plugin requires Windows 10 or later, x64. It reads HWiNFO’s local Windows Shared Memory or Gadget-registry interface. macOS, Linux and Windows-on-ARM are unsupported.
What are the exact requirements?
- Windows 10 or later, x64
- Stream Deck software 6.9+
- HWiNFO (installer or portable) running, publishing on Shared Memory Support or Gadget reporting
Dials are optional: a Stream Deck + or Stream Deck + XL adds the Sensor Dial action, but the key action works on any Stream Deck.
Is this the official HWiNFO plugin? Is it affiliated with REALiX?
No. It’s an independent, MIT-licensed project, not affiliated with or endorsed by REALiX/HWiNFO. It’s a ground-up TypeScript rewrite inspired by the original Go-based plugin by @shayne (no code shared).
HWiNFO editions and the 12-hour limit
Do I need HWiNFO Pro?
It isn’t required, but I recommend it if HWiNFO runs longer than 12 hours at a stretch. The plugin works best on Shared Memory, and HWiNFO Pro is the only edition that keeps Shared Memory on with no time limit.
- HWiNFO free: Shared Memory Support switches off after 12 hours and stays off until you turn it back on or restart HWiNFO. Auto can fall back to Gadget if reporting is enabled, then switch back when Shared Memory returns. Saved readings need explicit links to work across sources; these links are new in 1.7.
- HWiNFO Pro: no 12-hour limit. Shared Memory stays on, so keys keep their Shared Memory readings and HWiNFO’s min/max/avg without you touching anything. HWiNFO still needs to be running and publishing sensors.
The Gadget registry works as a fallback, with real limits:
- It carries only the readings you tick in HWiNFO.
- It has current values only. Since 1.7 a key set to Minimum, Maximum or Average shows N/A; dials still keep their own session range while data arrives.
- It has no producer timestamp, so a steady value can show Age unknown.
If you restart HWiNFO at least every 12 hours, the free version with Shared Memory gives the same result as Pro. Commercial use of HWiNFO needs a Pro license either way. I’m not affiliated with REALiX and earn nothing from the link.
Why did my values freeze / stop updating after about 12 hours?
That’s the free version’s Shared Memory timer expiring. HWiNFO stops publishing to shared memory after 12 hours of runtime and marks the mapping disabled. What you see depends on your data source:
- Auto mode (default): the plugin detects the disabled mapping and tries the Gadget registry. Enable Gadget reporting and select its readings, or configure explicit reading links (new in 1.7). Without links, a saved Shared Memory selection is missing on Gadget.
- Shared Memory only mode: no fallback; keys show
Shared Memory / is offuntil you re-enable Shared Memory Support in HWiNFO (Settings → Shared Memory Support) or restart HWiNFO.
After the timer expires:
- In HWiNFO Settings → Shared Memory Support, toggle it back on (resets the 12-hour clock).
- Enable Gadget reporting on the sensors you use, then explicitly link each reading so its selection survives a provider change.
- Buy HWiNFO Pro to remove the limit entirely.
Since 1.7, Shared Memory shows Not updating / check sharing after about 15 seconds without an advancing producer timestamp or observed value evidence. Gadget has no producer timestamp: before its first observed change, or after 15 seconds without another, it shows Age unknown / check Gadget. A steady registry value does not prove that HWiNFO stopped.
Data sources
Which data source should I use?
Auto prefers Shared Memory, tries Gadget when Shared Memory is unavailable, and switches back when it returns. Source availability and reading identity are separate: matching saved readings across sources requires an explicit link since 1.7. Use Shared Memory only or Gadget registry only if you want to keep one source.
| Shared Memory (preferred) | Gadget registry (fallback) | |
|---|---|---|
| Sensor coverage | readings HWiNFO publishes through Shared Memory | only sensors you tick in HWiNFO |
| Min / max / average | yes (from HWiNFO) | no (current value only) |
| Free-version limit | disables after 12 h | none |
| Enable in HWiNFO | Settings → Shared Memory Support | Configure Sensors → HWiNFO Gadget tab → tick Enable reporting to Gadget, then Report value in Gadget per reading |
Set it under Advanced → Connection → Data source in any key’s or dial’s settings (Auto (Shared Memory, else Gadget), Shared Memory only, Gadget registry only). It’s a global setting, marked All keys and dials: it applies to every key and dial.
A provider switch does not translate saved identities by itself. Configure explicit reading links for continuity in either direction. See Data sources for the full breakdown.
I ticked many readings in Gadget but only a few show up. Why?
HWiNFO gives every ticked reading a numbered slot, and a reading that stays ticked but is not being written (one disabled in the sensor window, for example) leaves its slot empty, so the list can carry gaps. Plugin versions before 1.6.0 stopped at the first gap; 1.6.0 reads across them. Update, then press the circular-arrow button beside the Reading box (Reload the sensor list). Details in Troubleshooting.
Why do min / max / avg show N/A?
Because you’re reading from the Gadget registry, which only exposes the current value; HWiNFO doesn’t write min/max/avg to the Gadget registry at all. Versions through 1.6.0 filled those fields with the current value. Since 1.7.0 they are unavailable: historical modes on keys and detail tiles show N/A with an empty value.
This happens when Shared Memory isn’t available, most commonly after the free version’s 12-hour timeout in Auto mode, or if you’ve forced Gadget registry only. When it’s active, the settings panel says so under its header: Gadget registry: current values only, no min, max or average. To get real min/max/avg back, re-enable Shared Memory Support in HWiNFO (or use Pro).
Dials calculate local session statistics from accepted observations on either source. Age unknown or another unavailable state replaces the display and resets the session since 1.7; the first live frame afterwards shows stats reset: data gap once.
What’s the difference between the key’s min/max/avg and the dial’s?
They’re two different things:
- Key (Sensor Reading): the Value shown setting and the key-press cycle display HWiNFO’s own min/max/avg, measured since HWiNFO started (or since you last reset them inside HWiNFO). These come from the shared-memory data, so they’re unavailable on the Gadget source.
- Dial (Sensor Dial): min/max/avg are local, per-reading session statistics. Since 1.7, the dial counts accepted observations once and calculates a sample-weighted average. Ordinary rotation preserves the session; data gaps and changes to the source or reading can reset it. See session statistics.
Sparklines
Why do my sparklines fill in slowly when a graph starts from empty?
The line holds 36 samples. Collection continues for subscribed readings while a Sensor Reading key or Sensor Dial is visible anywhere. HWiNFO Control keys do not keep polling alive. With no reading action visible, polling stops and the samples stay in memory; returning can append to them. The line is spaced by samples, so it does not measure the duration of that pause.
Since 1.7, the plugin collects subsecond value changes as well as advancing producer timestamps. It does not count repeated held frames. How quickly the line fills depends on HWiNFO, the plugin’s poll interval and the observed changes. With one accepted point every two seconds, 36 samples take about 72 seconds.
A skipped read, missing or non-finite reading, stale data (once the 15-second window opens), source transition or native-unit/type change clears the affected segment. A poll-interval change clears all segments; a pairing edit clears only a segment whose saved key now stands for a different measurement. A plugin restart also starts fresh. See collection rules.
Two more sparkline behaviors:
- Toggling °C/°F no longer resets the graph: it stores native values and just relabels.
- A frozen HWiNFO holds the line’s last shape for up to 15 seconds instead of flattening it. Once the key reports Not updating the line is cleared, and it restarts when data resumes.
Changing the plugin’s Read every interval (Advanced, Connection) does clear the line: the history is index-spaced, not time-stamped, so it does not preserve elapsed time across a cadence change.
Performance and resource use
Does it slow down my PC? How much CPU and RAM?
The recorded runs below used a live page at a one-second poll. They are measurements of those builds and setups, not a guarantee for every machine. Sources and harnesses are in PERF.md:
- CPU: a fraction of one percent of one core (~0.2 % long-run average on the live deck; zero polling cost when no Sensor Reading key or Sensor Dial is on screen, because the poller stops entirely).
- RAM: ~40–48 MB RSS, stable across externally monitored multi-hour soaks (PERF.md carries the measured slopes).
The parse path is incremental: one poll tick to decode ~520 readings costs about 10 µs with near-zero allocation (measured, see PERF.md’s 1.4.1 entry). Most of that memory is the Node runtime the Stream Deck app hosts plugins in, not the plugin’s own data; the plugin’s native bridge is a single 152 KB addon.
Does it get slower or use more CPU if I add more keys?
There is one reader regardless of how many keys and dials are visible. Adding keys adds rendering and host-message work, rather than another source read. The recorded load test used 518 readings plus eight dials at a 250 ms poll; see PERF.md for its results and limits.
With no Sensor Reading key or Sensor Dial visible, source polling stops. The plugin still maintains its connection to Stream Deck; this is not a claim of zero process CPU or fixed memory use.
How many sensors / keys can I use?
The plugin puts no limit on how many keys and dials show readings. HWiNFO typically exposes 500+ readings; the picker searches across all of them and lists every match, with no row cap (a 5,000-reading test tree stays responsive). You can place as many keys and dials as your Stream Deck hardware has, and one key isn’t limited to one reading: the key’s Readings on this key setting puts two, three or four readings on a single key, so a deck can show more readings than it has keys. All of them read from the same single poller. The load test above ran 518 key contexts and 8 dials; PERF.md has its results.
Can multiple keys show the same sensor?
Yes. Put the same sensor on as many keys as you like; each can have its own Label on the key, layout, theme, Text color, Decimals, °F, Value shown, Graph under the value (sparkline, bar or ring) and thresholds. They all read from the shared poller, so an extra copy adds rendering work, not another source read.
Alerts, thresholds and colors
Why is a key amber or red?
It’s crossed a threshold you set. In the key’s settings:
- Warn at → the whole key flips to an amber field with black text.
- Critical at → a red field with white text.
With Graph under the value set to Bar or Ring, those same thresholds also mark muted amber and red zones on the gauge track, escalating toward the alarmed end (the high side normally, the low side when Alert when the value drops to or below these numbers is ticked). The zones are fixed landmarks: they show whenever the thresholds are set, crossed or not, so red on the track is not by itself an alert. The field flip is. See Display: sparkline, bar, ring.
Alerts always track the live value (not the displayed stat: a key showing MAX still colors by the current reading). By default higher is worse; tick Alerts → Alert when the value drops to or below these numbers to flip the comparison (for fan RPM, free disk space, etc.).
On a dial, the alert colors the range-bar fill instead of the whole face; the touchscreen slot is too small for a full field flip. Once you set thresholds, the bar’s track also marks the warn and critical bands in dimmed amber and red, so you can see where the trip points sit before the value reaches them. The two Overview views (two rows and three rows) have no range bar: there an alerting row shows its value in the alert color instead. See Sensor Dial.
To disable an alert, clear Warn at and Critical at. Key alert palettes stay the same across themes. Physical recognition across displays and color-vision differences remains unverified.
How do I reset a dial’s session min/max?
Under Legacy, push the dial. Under Elite, hold the push for half a second. A stats reset clears can widen the reset to the rotation set or every dial; an HWiNFO Control key can also send it. The next accepted sample starts the new session. Data or source changes can also reset sessions since 1.7; see session statistics. Reset a key’s Shared Memory statistics inside HWiNFO.
Themes
Why isn’t “Default” the same as Void?
“Default” (called Deck default before this release) isn’t a theme; it’s a link. It means “this key follows whatever the shared theme is set to,” which you set under Advanced → Shared defaults → Theme. It happens to resolve to Void on a fresh install because Void is the default shared theme, but they’re not the same choice:
- Pick the Void chip → this key is pinned to Void forever, even if you later change the shared theme.
- Pick the Default chip → this key changes whenever you change the shared theme.
In the theme strip the Default chip has a dashed frame and a small link mark before its name, which tell it apart from the preset it currently resolves to; the line above the chips names the resolved theme: Default (shared: Void), or Void (set on this key) for a key’s own pick.
Also note: existing installs that predate the theme system stay on Graphite after updating, not Void, so the shared default you inherit may be Graphite, not the fresh-install Void. That way an update does not change how an existing deck looks. See Themes.
A per-key theme won’t follow my shared theme: why?
Because a per-key pick always wins. The shared Theme (Advanced → Shared defaults) only affects keys set to Default. If a key has its own theme selected, changing the shared theme won’t touch it; pick the Default chip on that key to make it follow again. The theme line above the chips tells the two apart: Default (shared: Void) follows the shared theme, Void (set on this key) is the key’s own pick.
Privacy
Is my data sent anywhere? Any telemetry?
No. No ads, no telemetry, no network requests (the plugin’s only connection is the local one to the Stream Deck app). It reads HWiNFO’s shared memory / registry locally and renders to your Stream Deck. Nothing about your hardware, sensors or usage leaves your machine. It’s MIT-licensed; the source is auditable.
Is the native binary signed? How do I verify what I installed?
The plugin’s native piece, bin/hwsm.node, is unsigned: it carries no Authenticode certificate. That alone does not explain a load failure or establish a security block. What you can verify is the bytes. Every GitHub release from 1.4.0 on prints the addon’s SHA-256 and the pack’s SHA-256 in its notes. Compare your installed copy in PowerShell:
Get-FileHash "$env:APPDATA\Elgato\StreamDeck\Plugins\com.lawrensen.hwinfo.sdPlugin\bin\hwsm.node" -Algorithm SHA256
A GitHub-release install matches its published hash byte for byte. Reporting a security problem privately: see SECURITY.md.
Setup and portability
Can I use the free / portable HWiNFO?
Yes. The free version has the Shared Memory limit described above; HWiNFO Pro removes it. The portable build also works while HWiNFO is running and publishing sensors:
- Add HWiNFO to Windows autostart yourself if you want the deck populated at login.
- If you see Access denied, review the account, session and permissions used to launch HWiNFO and Stream Deck. Matching elevation alone does not guarantee access.
Do keys survive reboots, HWiNFO restarts, or reordering sensors in HWiNFO?
Yes. On Shared Memory a key stores HWiNFO’s stable identity for the reading (sensor-id : instance : reading-id), not a position in a list; on the Gadget registry, which carries no ids, it stores the source name and reading label as HWiNFO writes them. Unique Gadget names keep working across restarts and reordering. Two ticked Gadget readings that share a source name and label are both withheld while both are ticked (in HWiNFO, untick or relabel the one your key should not show, and the other comes back on its own), and most Gadget selections saved by 1.6.0 keep working after the 1.7 upgrade; see the identity limits for the ones that need a reselection. If a saved sensor genuinely disappears (hardware/driver change, a renamed sensor profile, or a source or reading renamed in HWiNFO while on the Gadget source), the key shows Sensor missing / pick again: reopen its settings and pick it again.
Can I use Stream Deck + dials without HWiNFO Pro?
Yes. Dials can use free HWiNFO through Shared Memory or Gadget reporting. Their local statistics do not require Pro. Gadget still has the identity and freshness limits described above.
A key says “Access denied”: what’s wrong?
Windows denied access needed to read the sensor source. The error can come from Shared Memory or the Gadget registry and does not identify which access rule failed. Open the key or dial settings and choose Copy support report for support. See Troubleshooting for account, session and privilege checks.
What do the two-line screens on my keys mean?
They name the observed state and a next step. These are the 1.7 messages:
| Key shows | Meaning / fix |
|---|---|
Start HWiNFO / not detected | HWiNFO isn’t publishing to the selected data source (in Auto, to neither). Start it with Shared Memory or Gadget reporting on, or check Data source. |
Source busy / retrying | The sensor source was busy or changed during a read. The plugin retries automatically on the next poll. |
Shared Memory / is off | HWiNFO reports sharing disabled (including after the free version’s 12-hour timer): re-enable it (or use Gadget; Auto falls back by itself). |
Not updating / check sharing | No new Shared Memory measurement evidence has been observed within the grace period. Check HWiNFO and Shared Memory Support; a busy connection can also prevent reads. |
Age unknown / check Gadget | Gadget has no producer timestamp. The plugin cannot tell whether unchanged values are steady or left by a killed or crashed HWiNFO. Check HWiNFO and Gadget reporting. |
Access denied / open settings | Windows denied access needed to read the sensor source; the error does not identify which access rule failed. Open settings and choose Copy support report for support. Review the Windows account, session and privilege settings of HWiNFO and Stream Deck. |
Tick sensors / in Gadget | The Gadget registry is present but has no readable sensor rows. In HWiNFO, open Configure Sensors and the HWiNFO Gadget tab; check Enable reporting to Gadget and tick the readings you need. |
Pick a sensor / in settings | No sensor selected yet: open the key’s settings. |
Sensor missing / pick again | The saved sensor isn’t in HWiNFO’s current output; pick it again. |
Source error / open settings | The sensor source could not be opened or validated. Open settings and choose Copy support report for support. |
Needs x64 / Windows | Not a 64-bit Windows machine (Windows-on-ARM / other); unsupported. |
Bridge failed / reinstall | The native HWiNFO bridge (bin/hwsm.node) could not load; this does not identify the cause. Reinstall the plugin from its release package. If Windows or security software reports a block, keep that report and the package hash for support. A checksum identifies bytes; it does not establish safety. |
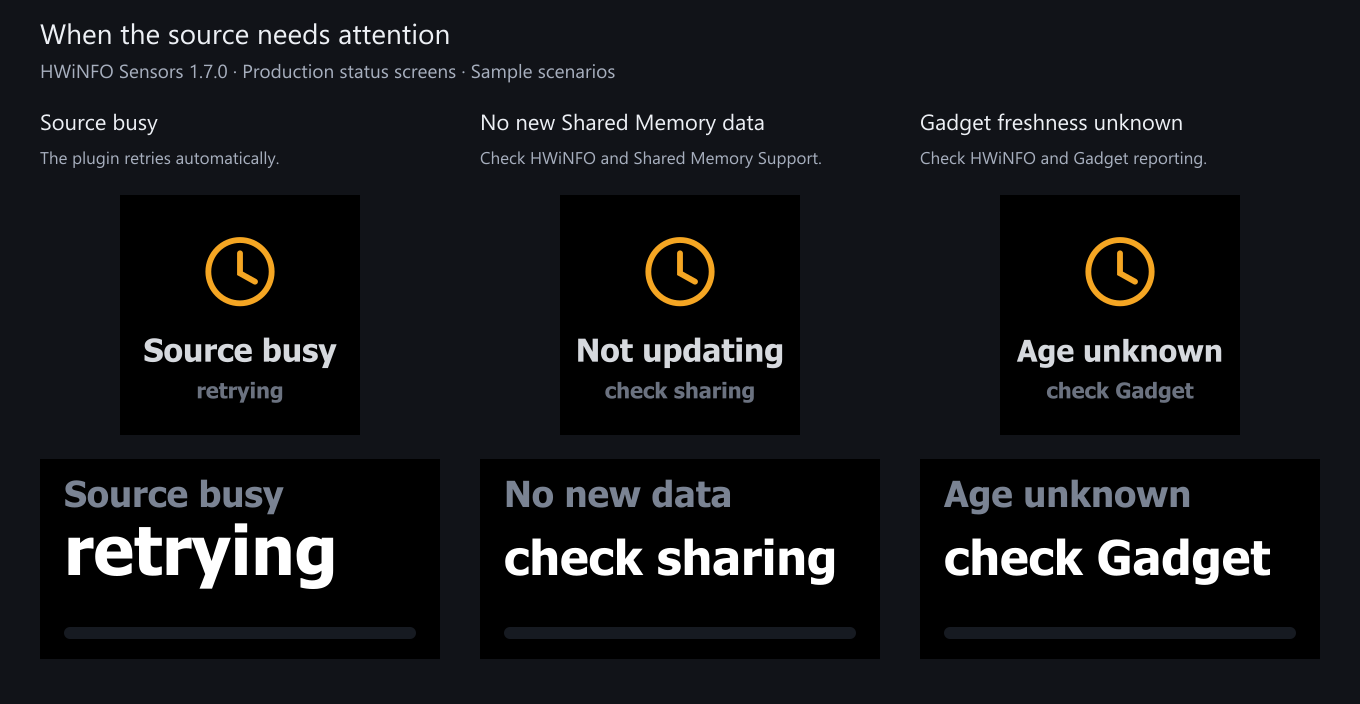
Simulated source states rendered by the 1.7 production code, not a hardware photograph. See Status screens for the full list.